|
|||
|
Team |
IS247 Final Project: Zooke Image Visualization
Erick Herrarte, Anita Wilhelm, Kevin Li This project stems from
a camera phone based picture annotation game, developed by Erick
Herrarte and Anita Wilhelm for their MIMS final project. To establish
a context for this project, relevant details of the game are briefly
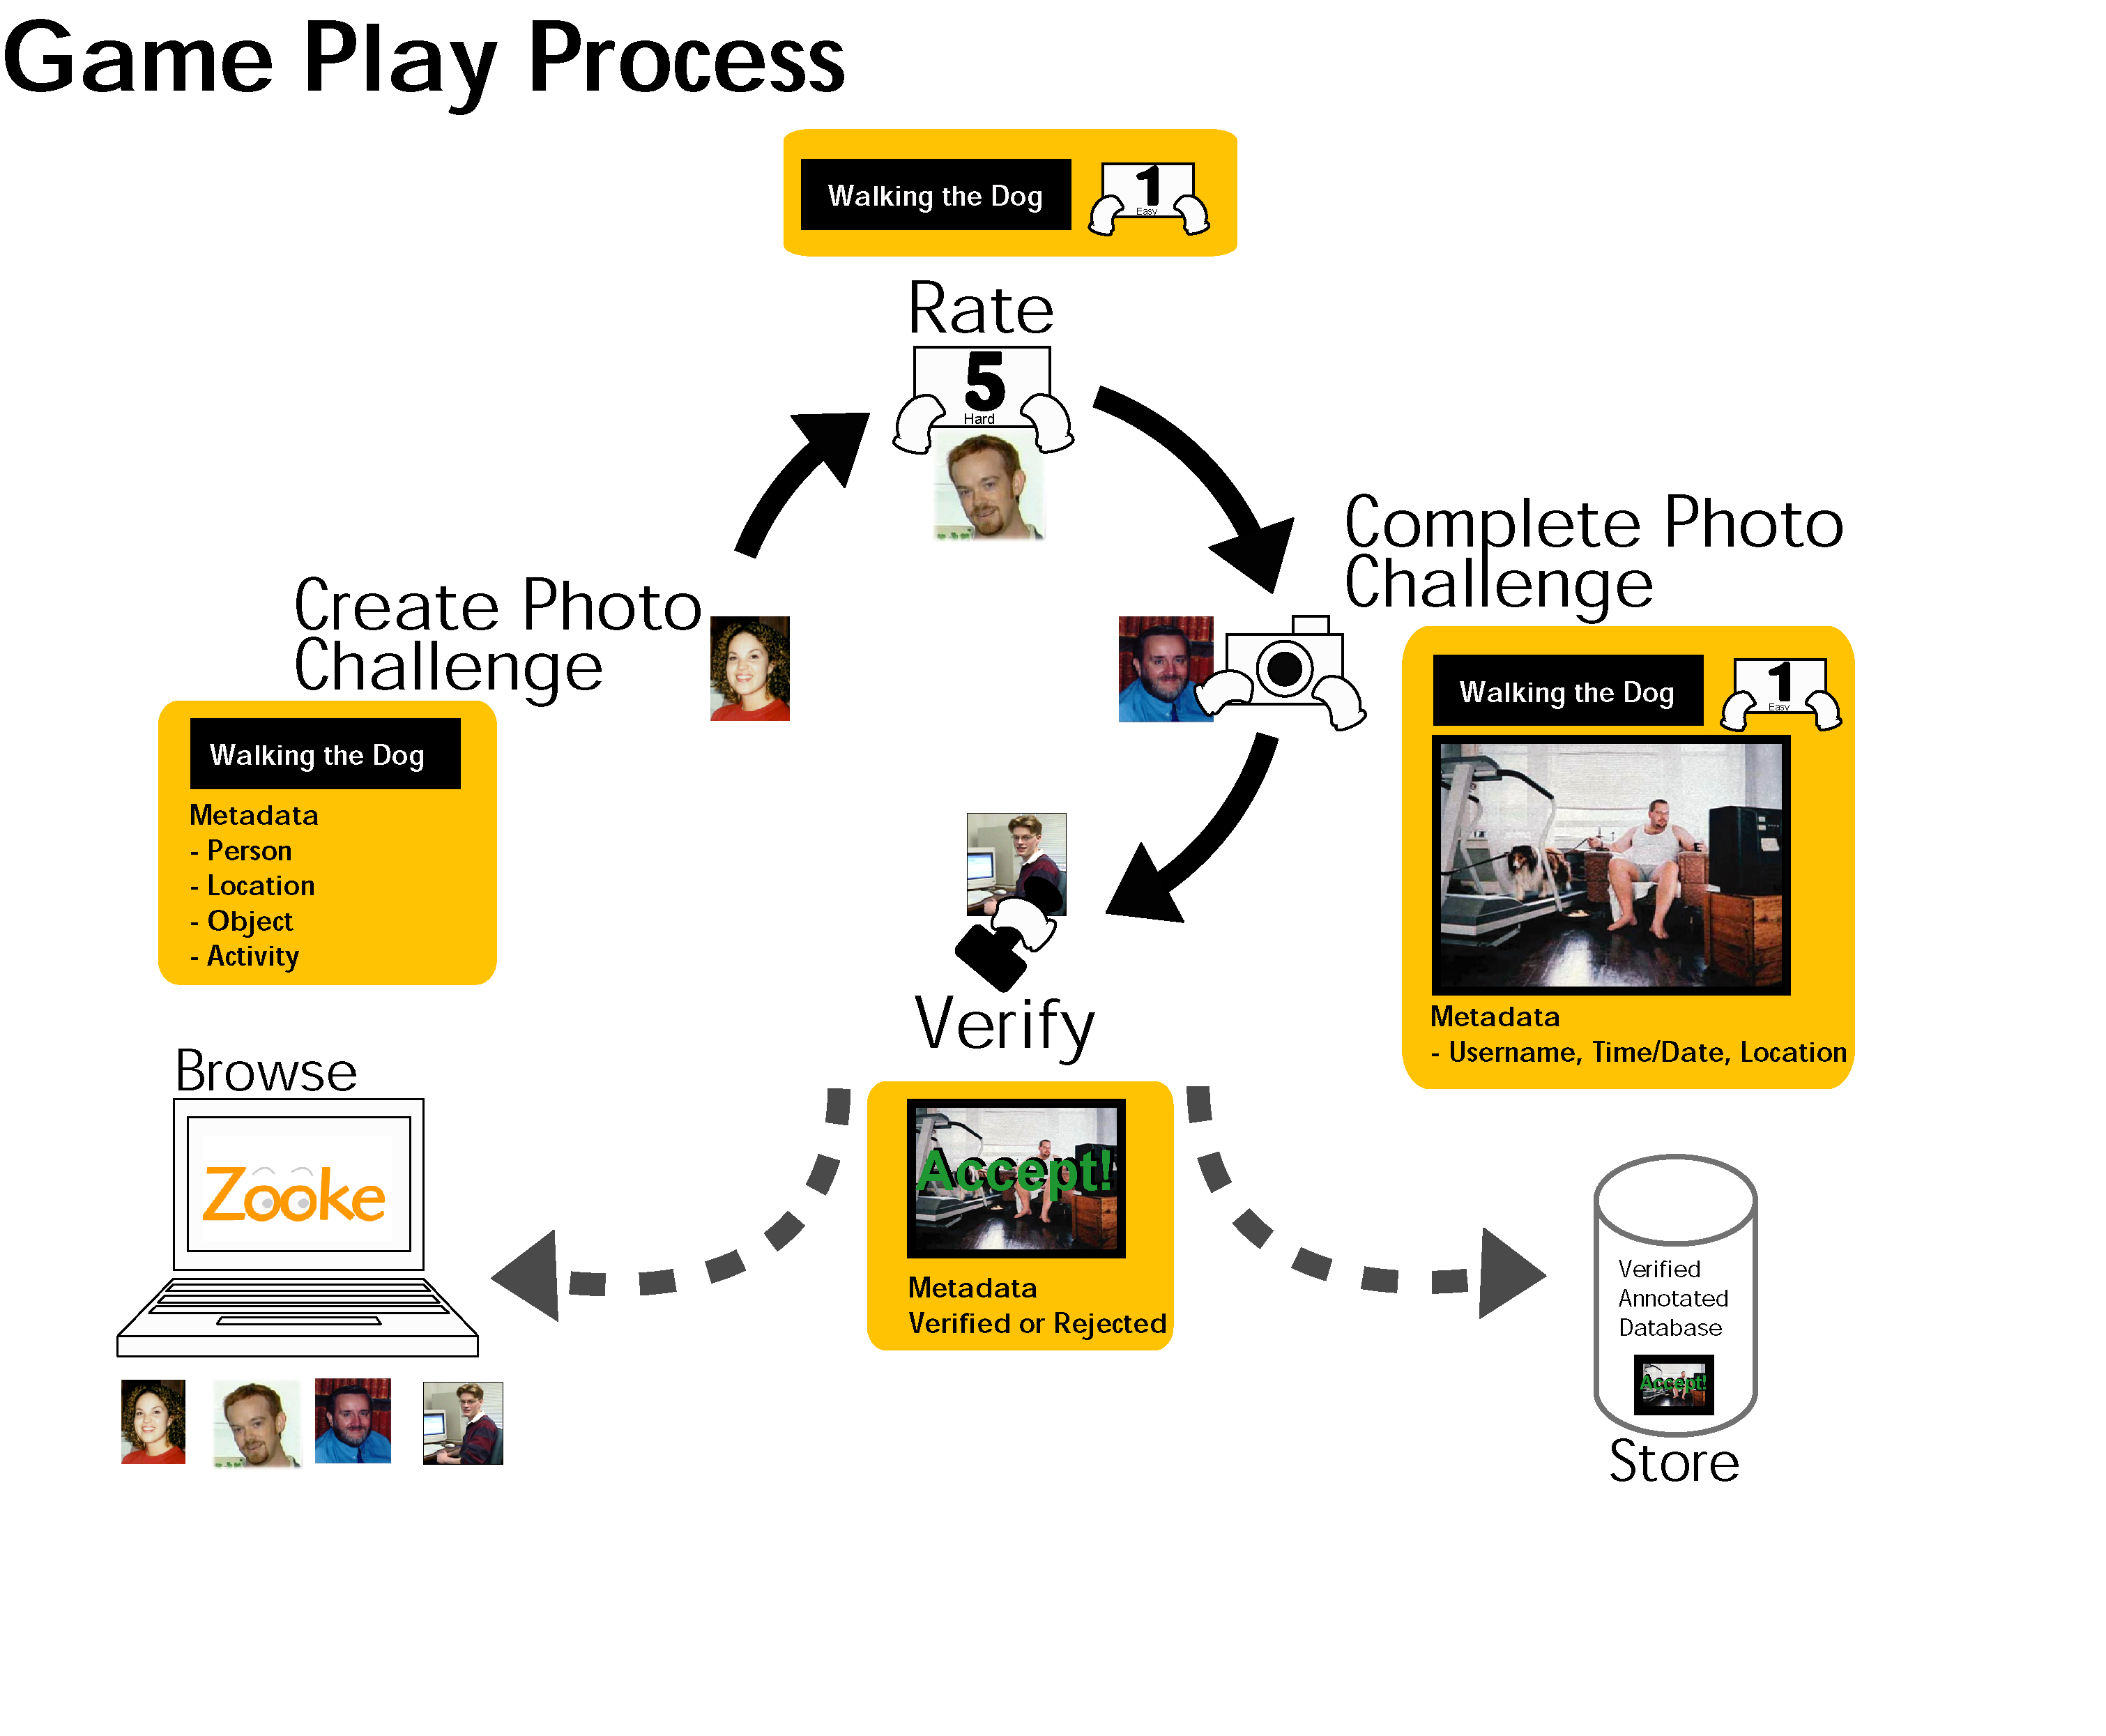
described here. Called Zooke, the Game Play Process is illustrated
in (Fig. 1). First a photo challenge is created. This is a word
or phrase for which people will try to take representative photos.
This photo challenge is then distributed to other people within
the photo challenge creator’s group for a difficulty rating.
After that, the photo challenge is then distributed to other members
of the group, who upon retrieval, attempt to take photographs represented
by the photo challenge phrase. These photo challenge/photograph
pairs are then subject to a verification process after which the
accepted photos appear on the web for viewing and browsing. It is
this final phase of the process that this project is focused on.
We have designed an interface for viewing and browsing these images
while keeping sound information visualization practices, as well
as user interface design principles, in mind. For the manipulation of completed photo challenges over the web, the following list of tasks was generated: Browse/Search Zookes:
As well, you could imagine this temporal display relating to a very different medium altogether – blogging. In some ways a “post” is creating a challenge activity that is “replied” to by a user with a photo in order to complete the challenge. Displaying the author’s name is the same as displaying the Zooke player’s name. Dan Perkel, Jeff Towle, and Mary Hodder are working on the interface for searching blogs, with Technorati [8]. Research in visualizing email threads is also pertinent. Some of this research includes work done by Bernard Kerr where arcs are used to help illustrate the flow of message threads [4]. Anton Leuoiski has done some interesting work in visualizing archives of electronic email [7]. Perhaps of most direct relevance is People Garden, a project involving the visualization of message threads. Usability work on photographs and photographic organization has been performed in personal collections which may suggest image attributes pertinent to users [6]. HIIT is currently writing a paper on how people’s photographic sharing behavior. As well, Garage Cinema Research has been performing a number of interviews and has submitted a paper on this to CSCW. Adobe Photoshop Album software is used for viewing personal photograph
collections [10]. They provide a time slider as a navigational tool
for viewing pictures from different times. Displayed in the background
of the slider is a histogram of photographs according to different
time intervals. This provided inspiration for our visualization
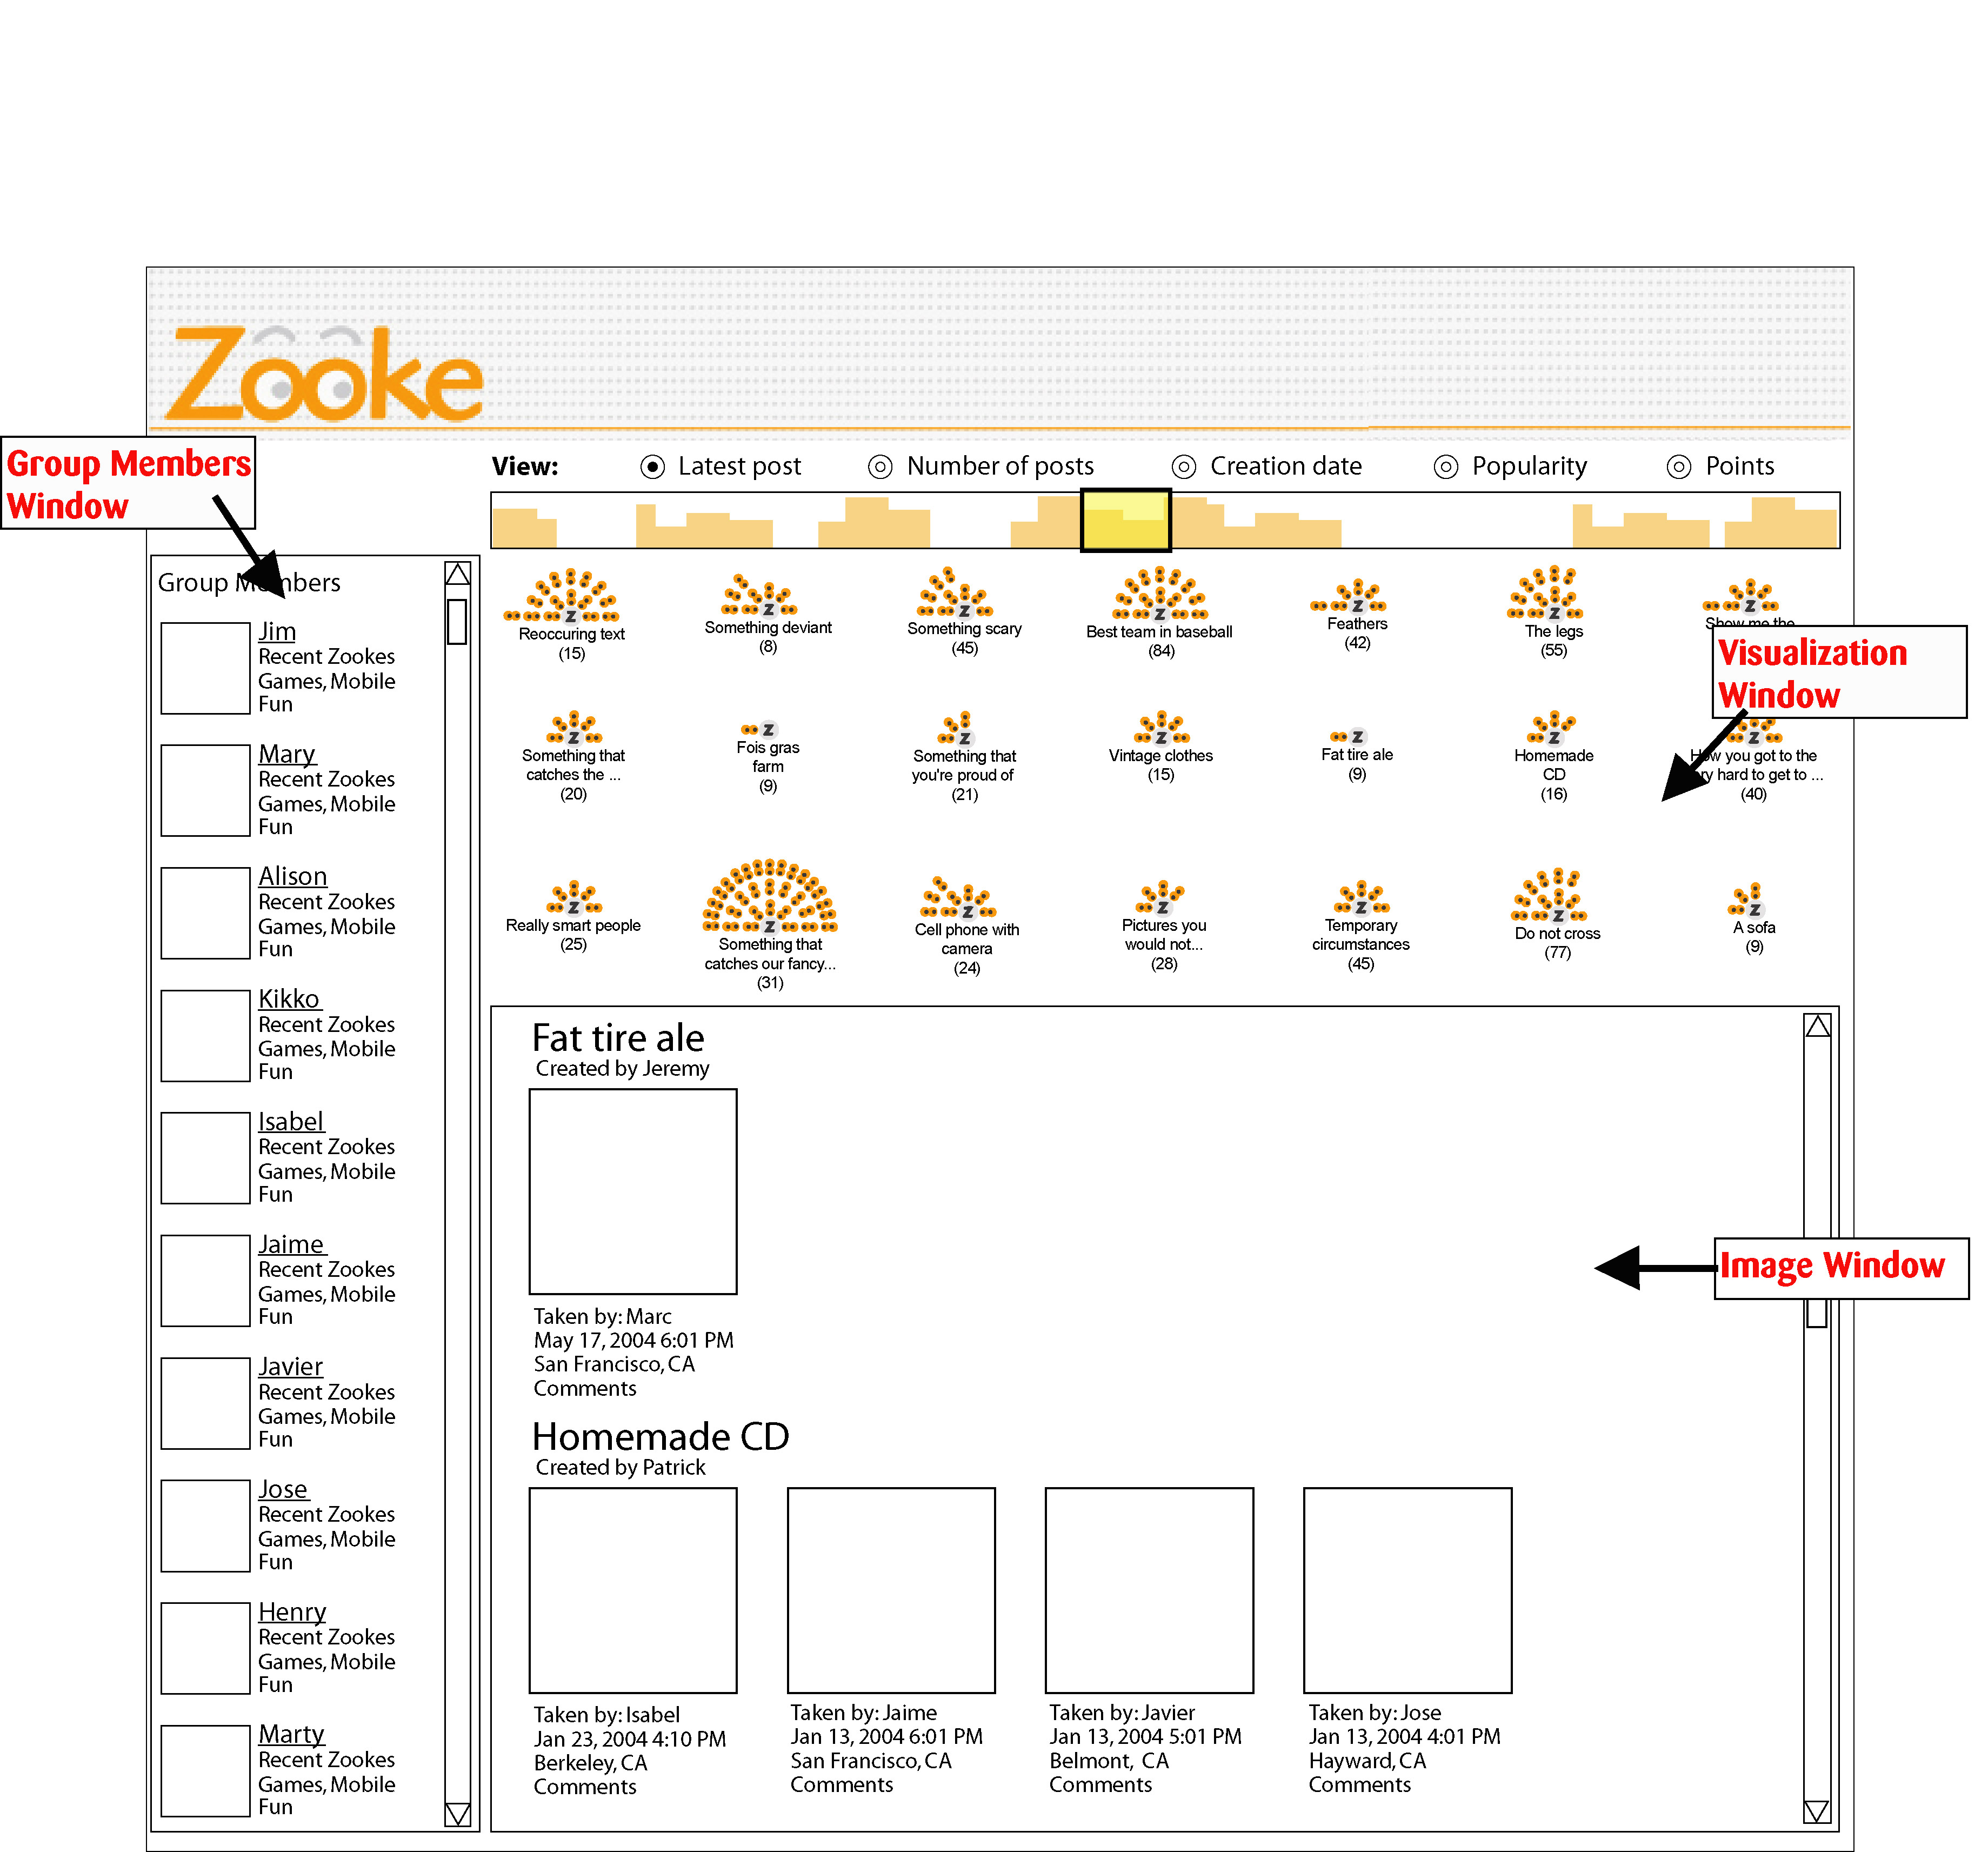
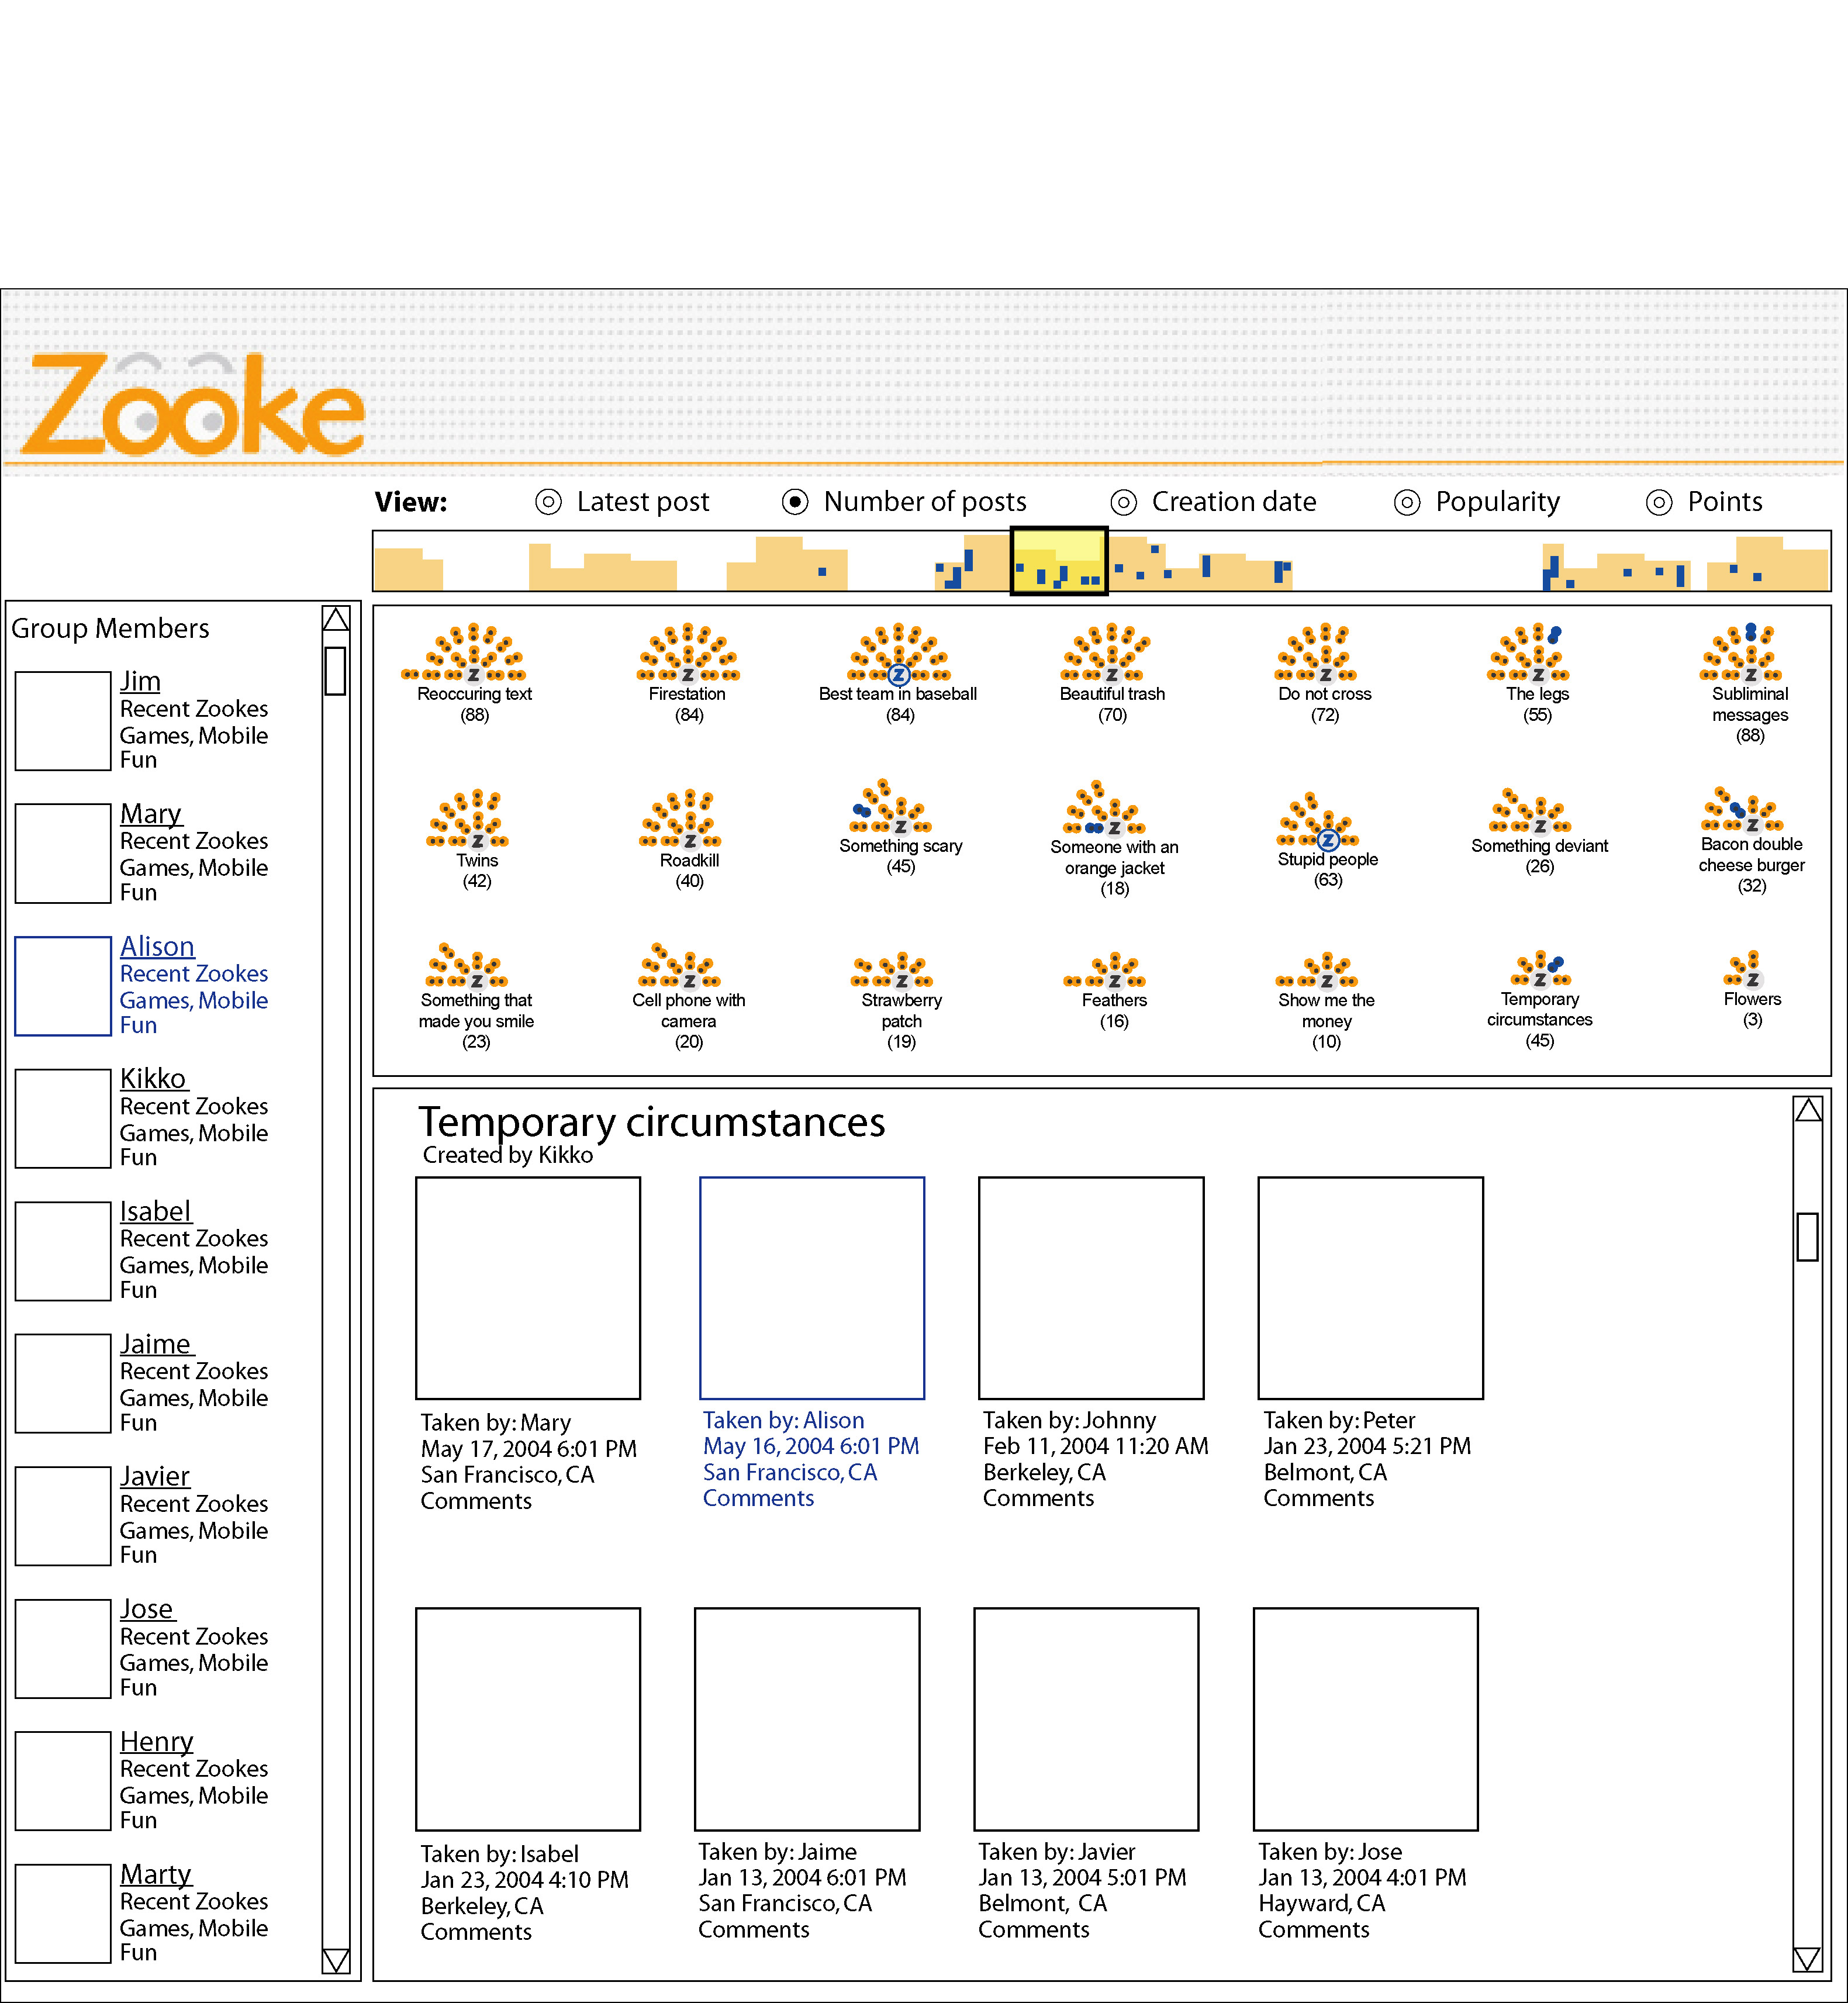
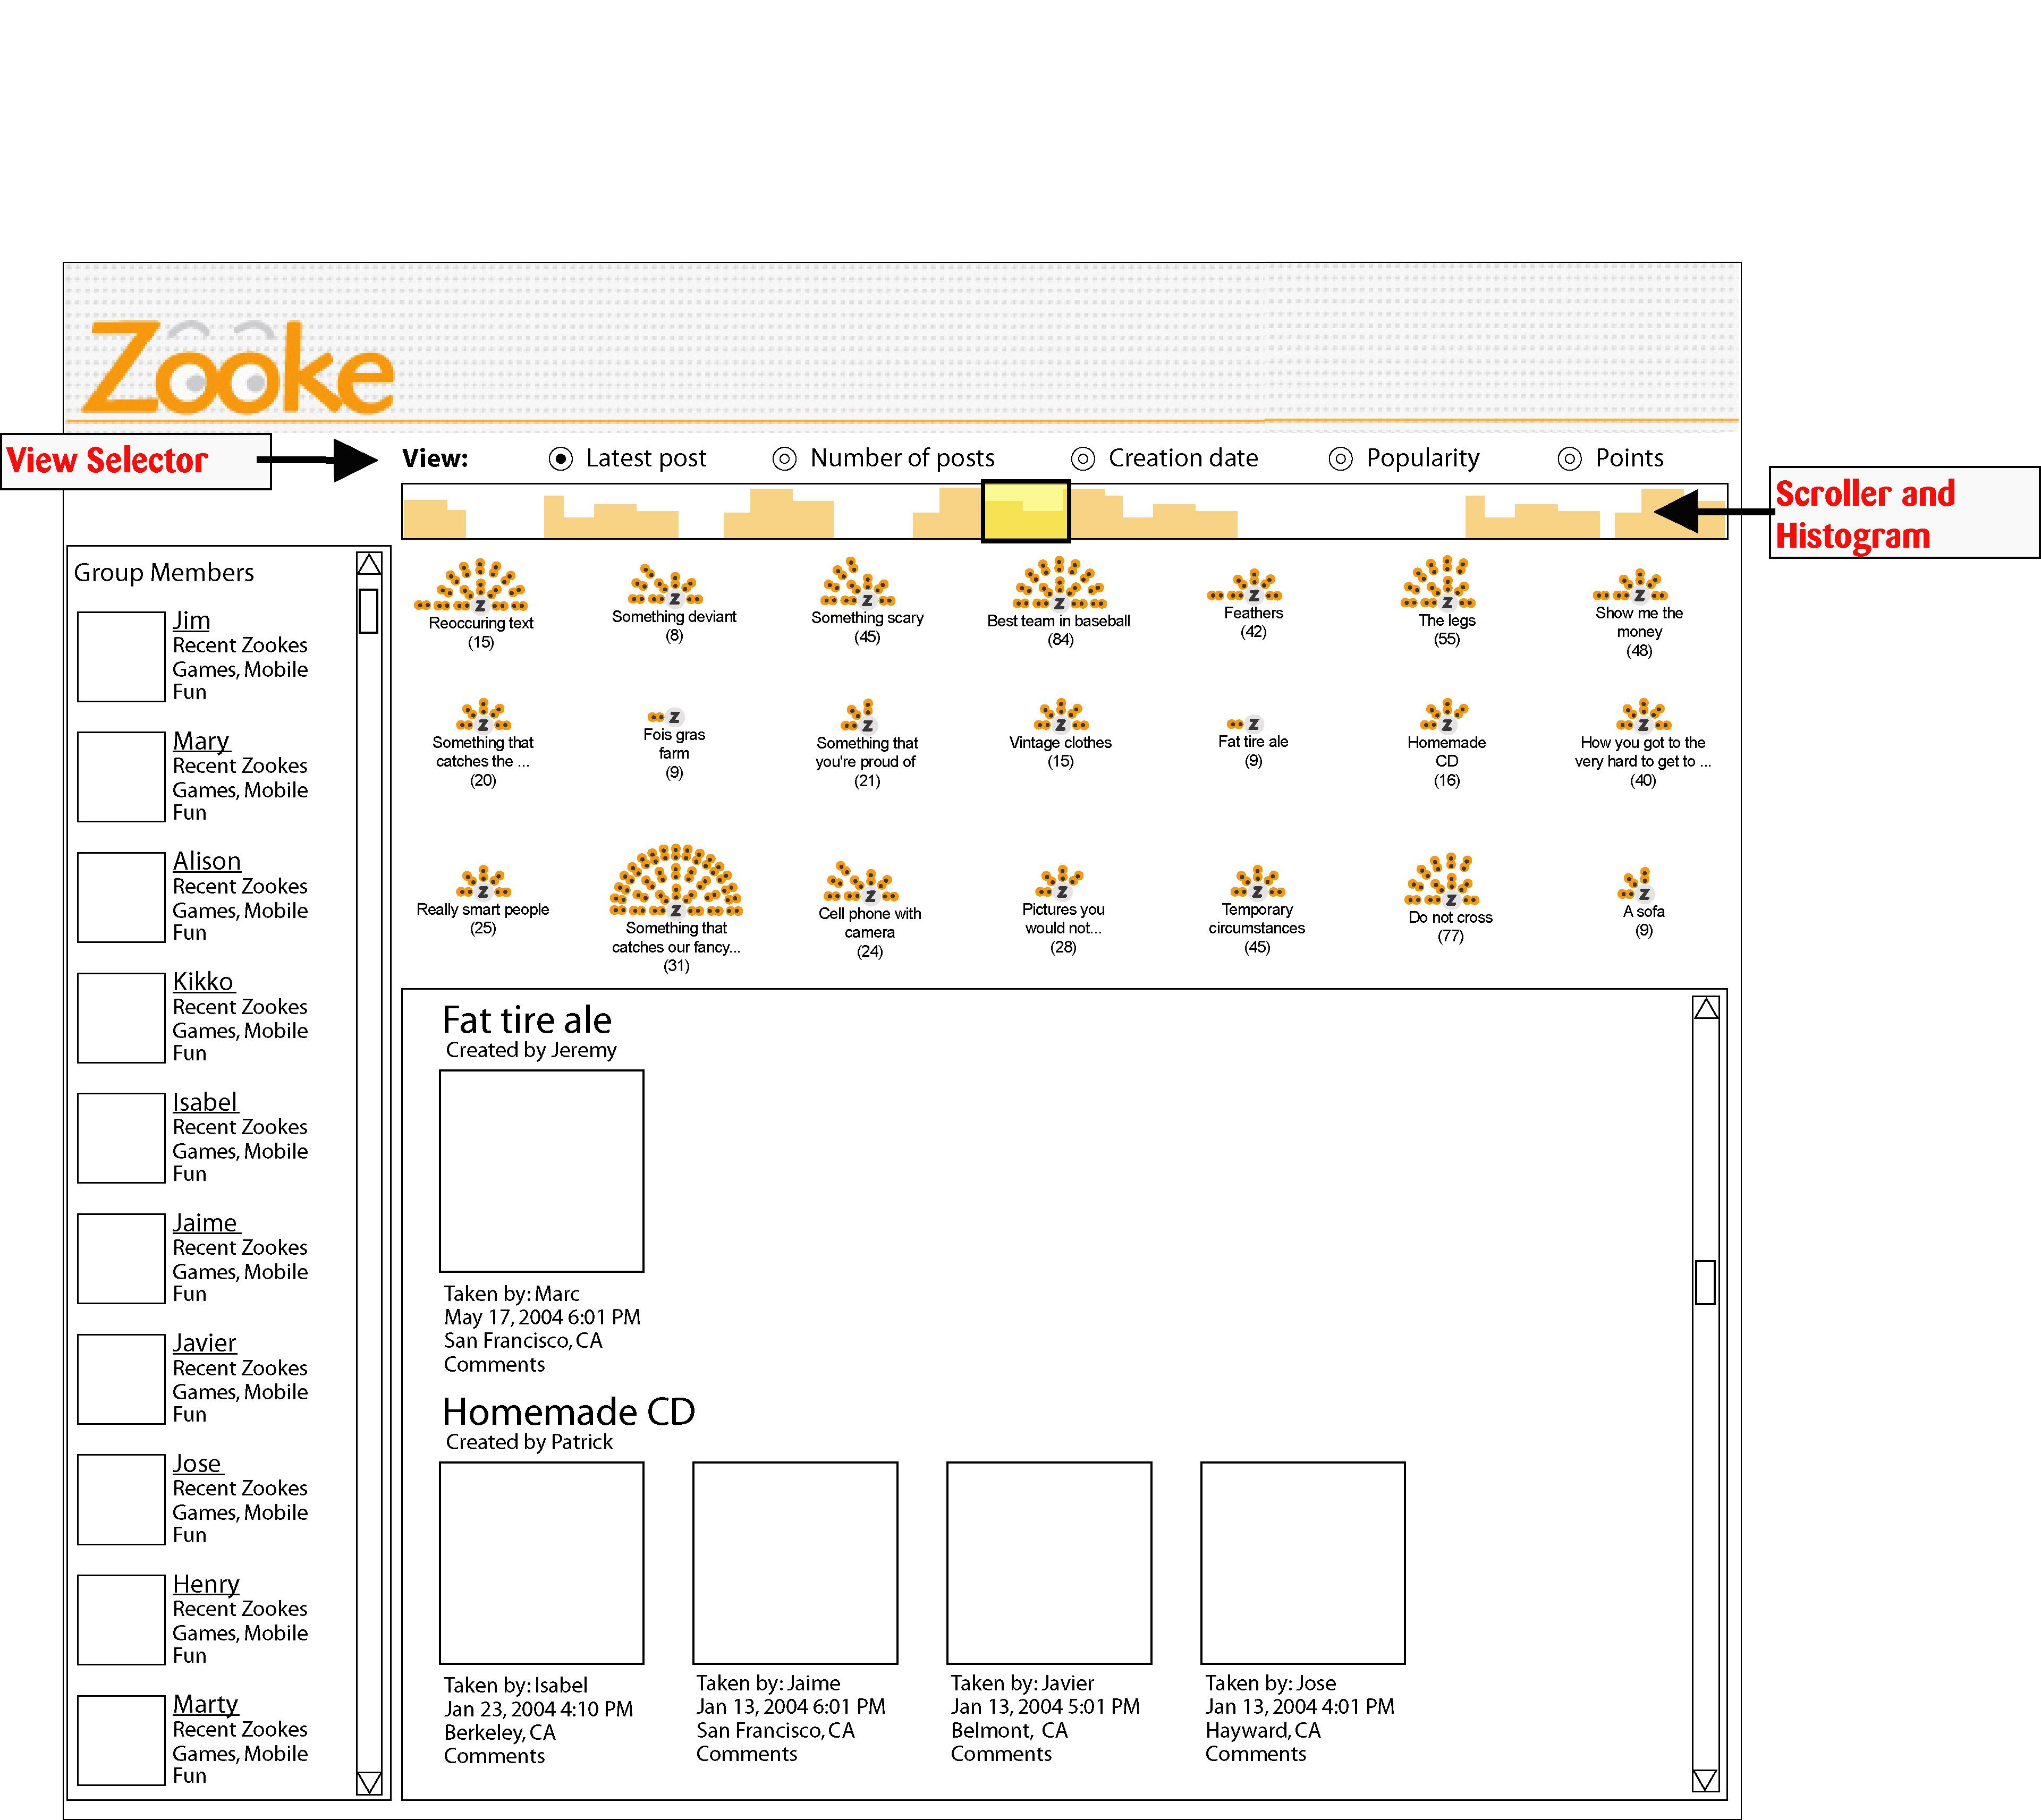
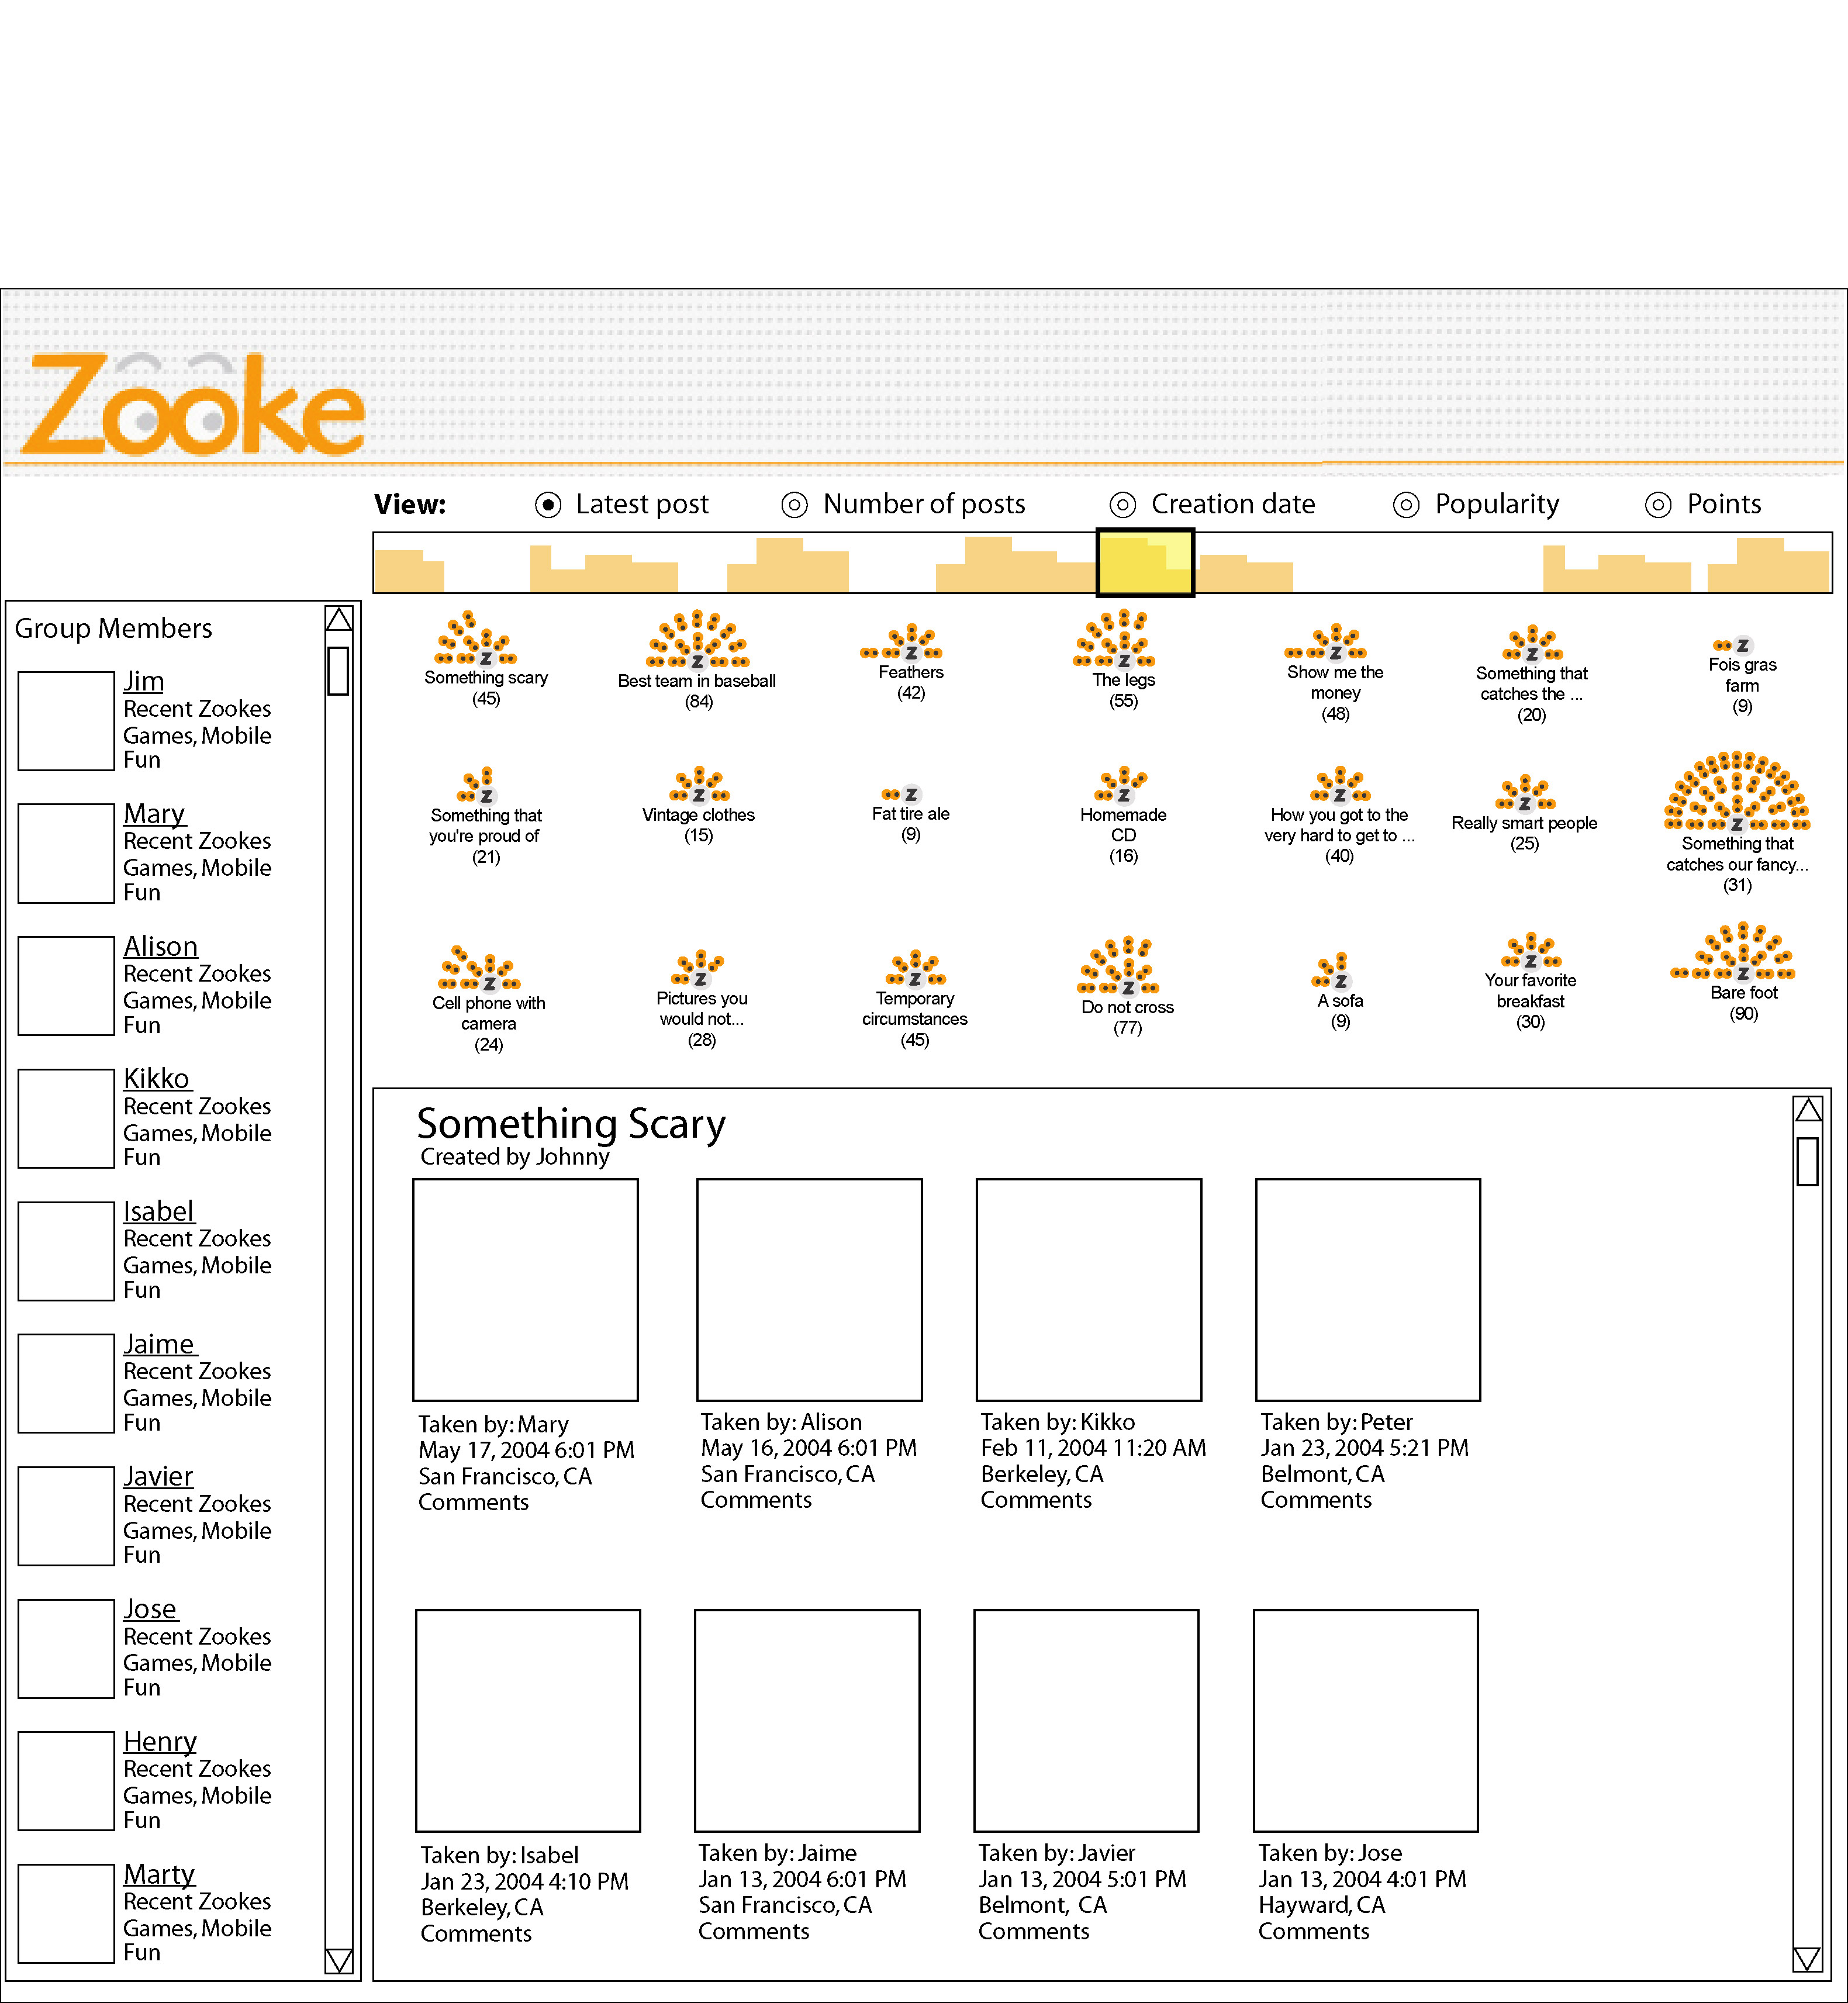
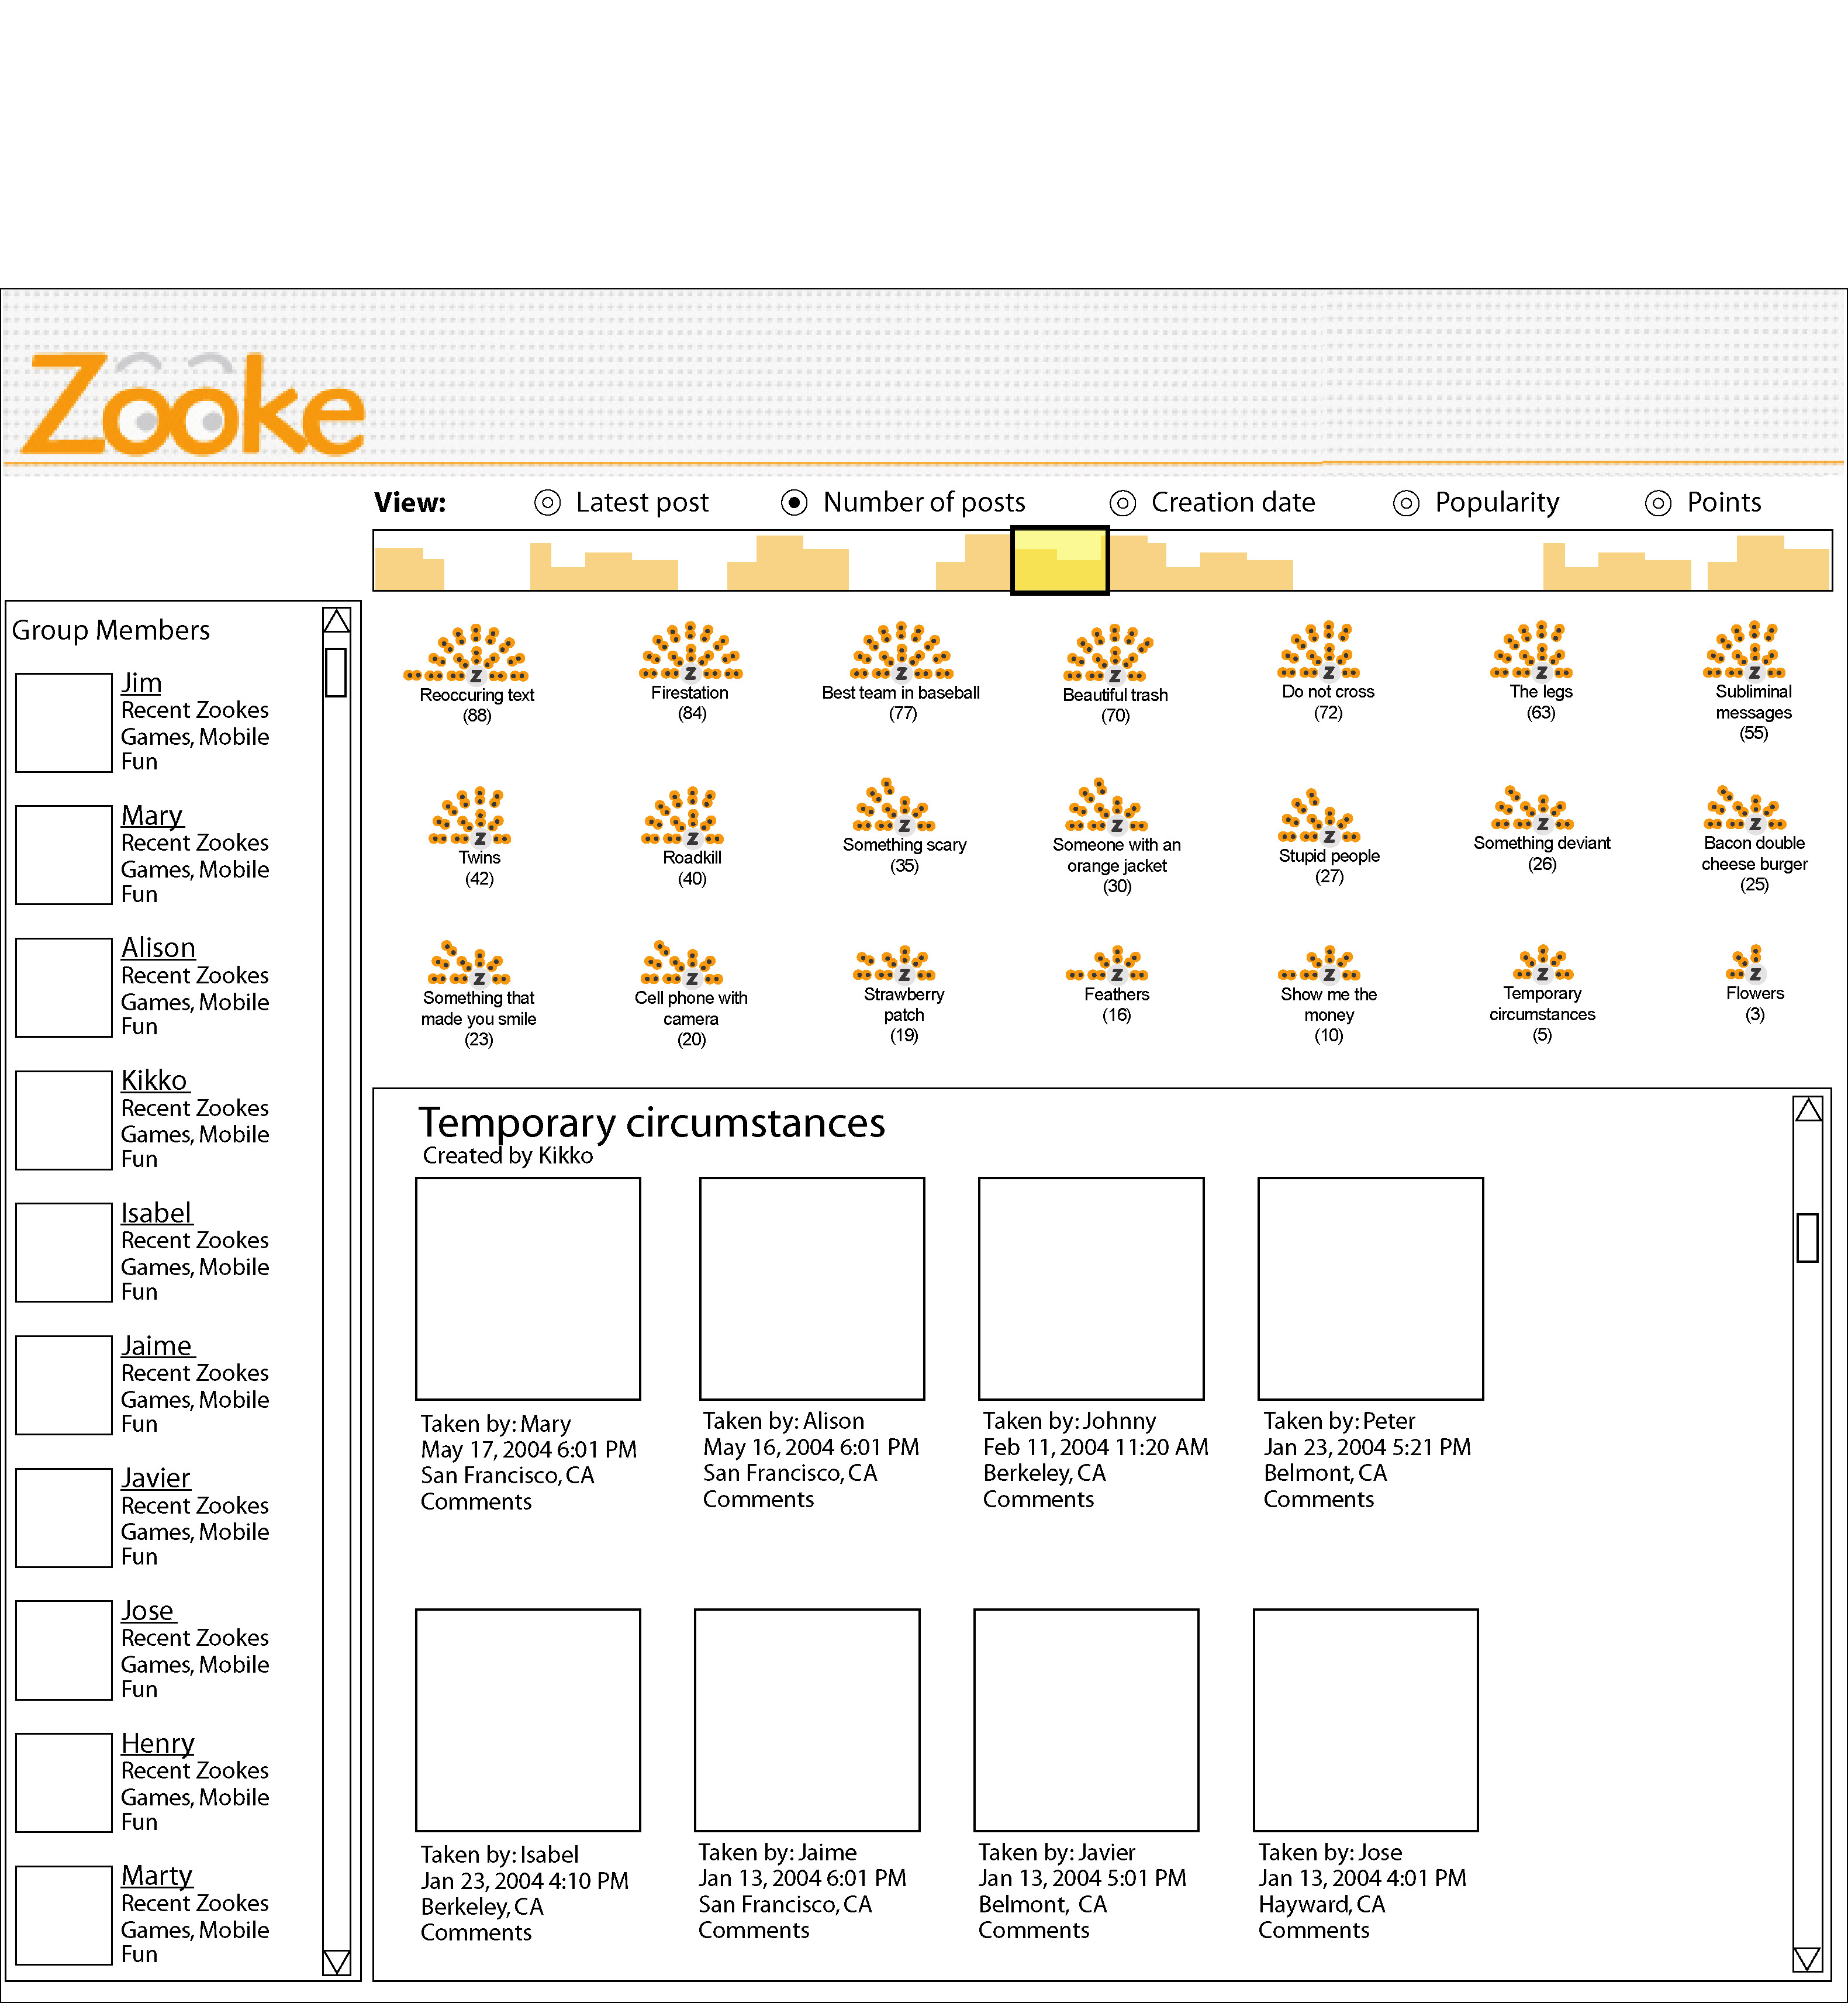
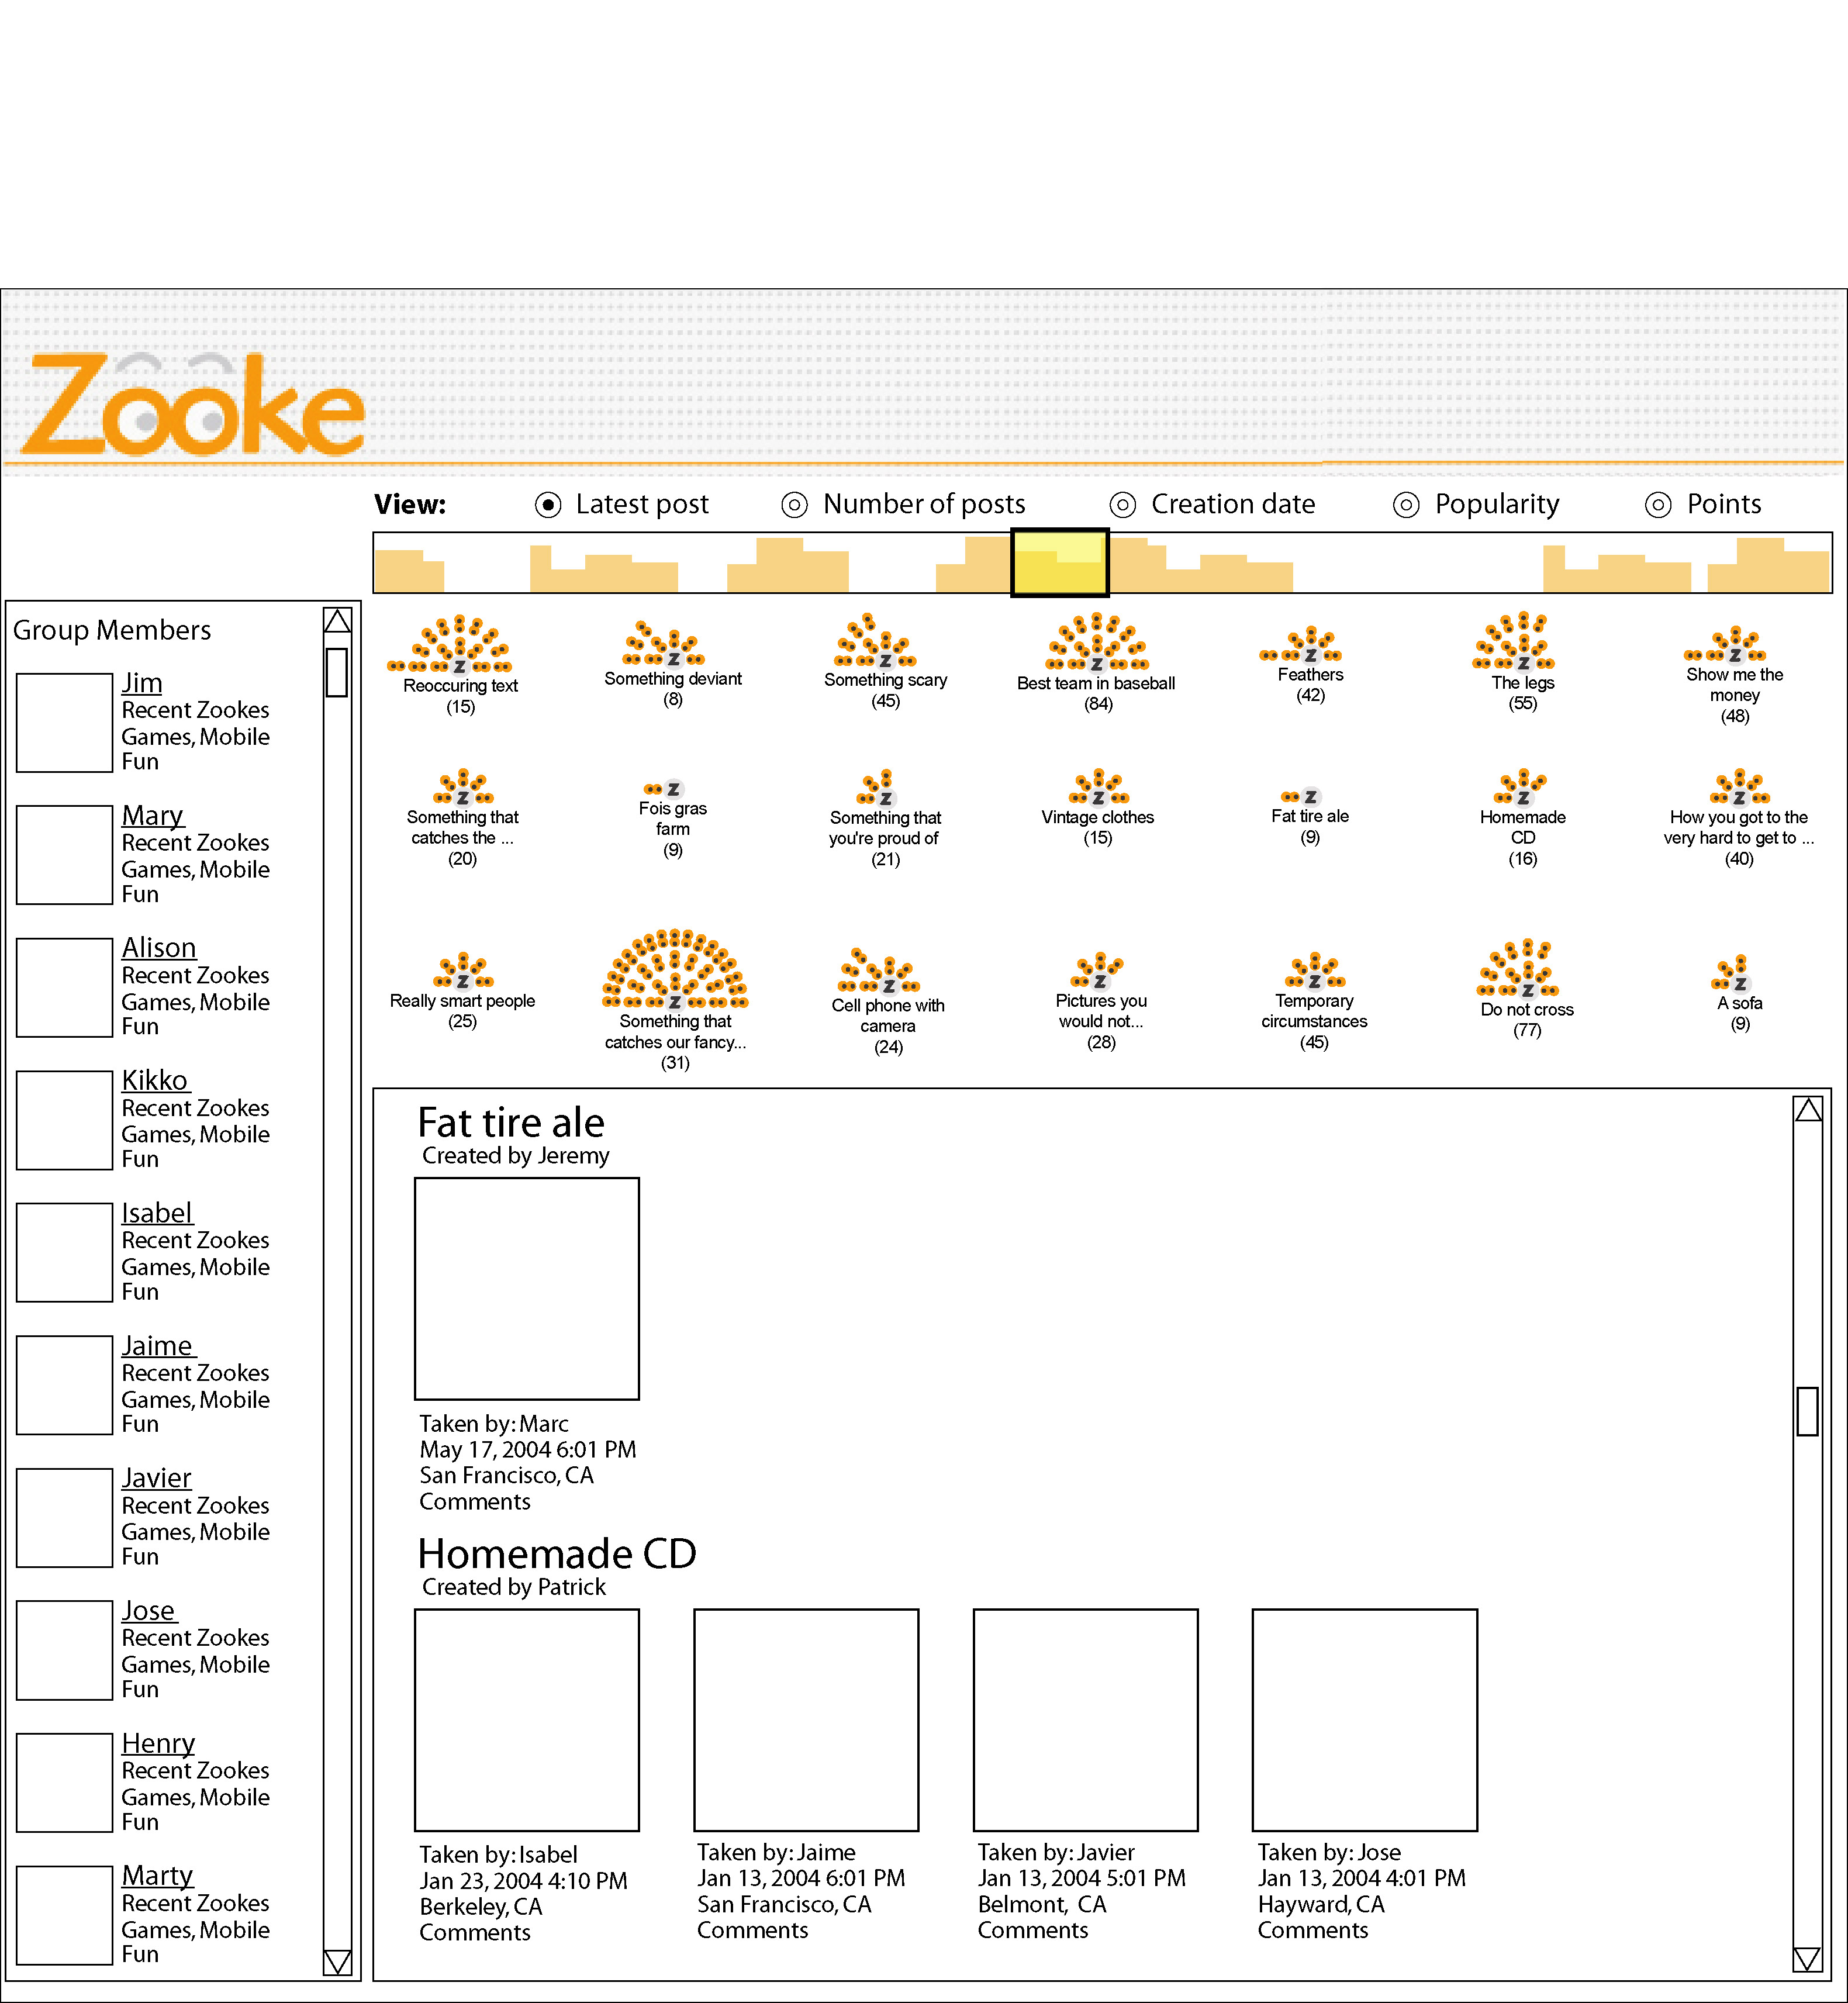
navigational tool. The interface is divided into three sections (Fig. 2). Group Members are listed in the left side panel. The Visualization Window displays Zookes that are appropriate for the current search settings, which will be explained in greater depth below. The Image Window resides on the bottom, displaying images grouped by Zooke title. Each image is accompanied with some basic attribute data. Only the Zookes displayed in the Visualization Window are displayed here as well. Within the Visualization Window, each Zooke is represented by a “Z” symbol. Surrounding this symbol are little circles, each one representing photos that belong to that Zooke. Originally, a pair of eyeballs was to be used for each photograph. However, this was deemed too confusing, as well as a waste of space. Instead circles provide a simpler, cleaner interface, while still preserving the ability to identify relative Zooke sizes, serving their original purpose. (Please note: Current mock-up images depict the eyeballs used in early versions, in the final implementation, however, circles will be used.)These circles are usually orange in color, but if a member has been selected from the left panel, then photos taken by that person will become blue colored (Fig. 3). The appropriate images will also be surrounded with a blue border in the Image Window. The change in coloring will allow the user to quickly recognize which photographs are of interest. Residing at the top of the Visualization Window is a slider which allows navigation through all the Zookes in the repository, along the particular dimension that has been selected using the radio buttons above. The user can choose to view based on latest post, number of posts, creation date, popularity, and points. The histogram shows the distribution of the photographs along the selected dimension, with the current view being highlighted under the selector box (Fig. 4). This provides feedback to the user within the navigational tool, allowing them to see where the images they are currently viewing reside relative to the other images. Dragging the selector box left or right with the mouse, will change the view of the Visualization Window and Image Window to reflect the new set of Zookes. Within a given set of Zookes being displayed in the Visualization Window, the ones with the largest values in a given row are at the rightmost end, while each row holds larger values than the one above it (Fig. 5 & 6). As the selector box is moved and a new set of Zookes is chosen to be displayed, the Zookes are animated as they slide into their new positions. The result set of Zookes can also be filtered by using the Group Members panel on the left. Clicking on the checkbox next to a group member’s name effectively filters out photographs taken by other people, displaying only Zookes containing photographs taken by that person. For these Zookes, photographs taken by other people will still be displayed but the circles representing the ones taken by these member(s) will be colored blue in the Visualization Window, will be outlined in blue in the Image Window, and will be highlighted blue in the histogram (see Fig. 3). Download larger files of all images displayed above (.zip) The proposed interface was to be designed using a combination of Flash and Javascript, with the two communicating with one-another. The Visualization Window,Scroller, and Histogram will be developed using Flash, with the Group Members panel and the Image Window will be generated using Javascript. Interaction with the Visualization Window sends data to the server, which then processes the interaction using data stored in the backend server and then sends out the newly generated html back to the client. We had originally planned on building a fully functional interface to connect to the Zooke project backend so that images taken by Zooke players could be browsed in real-time. However, given time constraints, this was not feasible. Instead, the above mockups were generated to help describe the design factors that played a role in this project. [1] Email Visualizations to Aid Communications. [2] Fernanda B. Viegas et al. PostHistory: Visualizing email archive.
[3] Reinventing Email project. [4] Bernard J. Kerr. Thread Arcs: An Email Thread Visualization.
http://domino.watson.ibm.com/library/cyberdig.nsf/1e4115aea78b6e7c85256b360066 [5] Jack Gwizdka. TaskView – Design and Evaluation of a Task
Based Email Interface. Proceedings of the 2002 conference of the
Centre for Advanced Studies on Collaborative research. [6] Kerry Rodden et al. How do people manage their digital photographs? Proceedings of the ACM Conference on Computer Human Interaction, 2003. http://www.rodden.org/kerry/chi2003.pdf [7] Earchivarius [8] Technorati. [9] Futurice. [10] Adobe Photoshop Album. [11] Rebecca Xiong and Judith Donath. People Garden: Creating data
portraits for users Proceedings of UIST, 1999. |
||